
Our mission.
To empower people with low vision or blindness to actively participate in their communities.
Our vision.
Low vision or blindness will not limit independence.
Our purpose.
We see beyond sight loss:
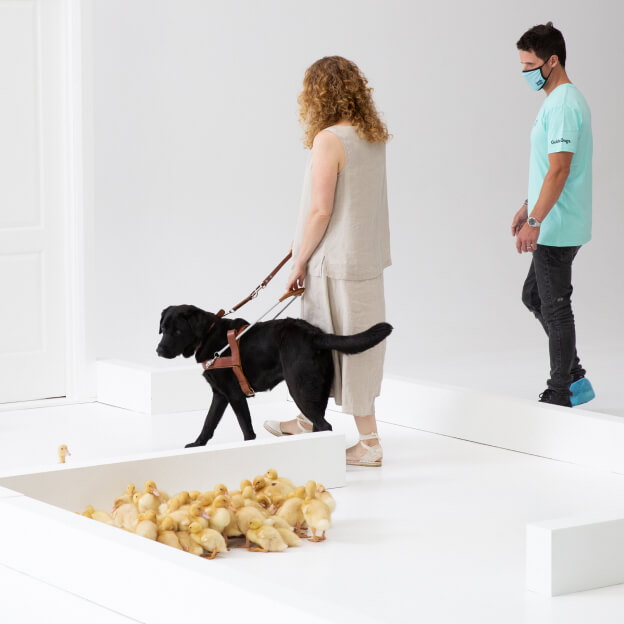
- Guiding Clients to independence,
- Seeking new ways to prevent blindness,
- Creating connected communities.
Our values
Our values
-
Our Clients come first in everything we do.
We believe everyone should have access to the support and tools required to live a free and independent life.
-
Lead with head and heart.
Forever focused on our purpose and mission, we combine care and careful planning to deliver successes worth celebrating.
-
Never stop exploring.
We’re fearlessly creative. We’ve always asked and answered the tough questions and if there’s a better way, we’ll find it.
-
Walk the talk.
The buck stops with us. So we keep our word and keep going, no matter what.
-
Lift each other.
From a guiding hand to a high five, we unleash and acknowledge everyone’s potential.
Key messages.
A message from our CEO
A focus on innovation and exploration has been the backbone of Guide Dogs NSW/ACT.
A message from our CEO
A focus on innovation and exploration has been the backbone of Guide Dogs NSW/ACT.
There is no doubt that the last financial year was a year of hardship for many, and one of the most challenging times we have experienced as an organisation, a community, and a nation. As we find ourselves facing a whole new world to the one we knew before COVID-19, we understand and acknowledge the trepidation and fear this may bring. At Guide Dogs NSW/ACT, however, we are determined to find the new opportunities that we know our new ways of living and working are sure to bring.
This focus on innovation and exploration has been the backbone of Guide Dogs NSW/ACT since our inception. Indeed, for more than 60 years, Guide Dogs organisations across Australia have been in the business of helping people with low vision or blindness overcome barriers. Supporting our Clients to put one foot in front of the other and have the courage to move forward, no matter the obstacles they may face.
In the 2021 financial year, the philanthropic community dug deep, with over $1 million in grants from Trusts and Foundations, Clubgrants and local government grants to Guide Dogs NSW/ACT; a signifant increase on the $650k received in financial year 2019-2020.
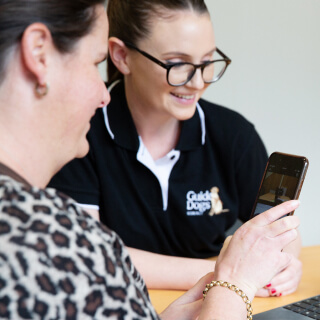
This is a true testament to the generosity of Australians, who seek to support those most vulnerable in our communities even during the most trying of times. These very special supporters enabled Guide Dogs NSW/ACT to achieve our mission via various projects, including delivering the Positive Paws Program for disadvantaged high school students, distributing and training our Clients with the latest in assistive technology and low vision equipment, and upgrading our training centre at Glossodia. We are very grateful for this incredible support.
As we work together to accept our “new normal”, we look to our beloved history to create a new framework for how we motivate and support our Clients to keep looking ahead. We look to the innovation and tenacity on which Guide Dogs NSW/ACT was founded, and remain committed to curiosity; to asking the right questions, accelerating innovations, and seeking inspired solutions to create a better tomorrow for those who need us the most.
Guide Dogs NSW/ACT was built on courage. It is this fearlessness that has driven us to invest in new technologies to help us make data-based decisions; that makes us brave enough to recognise where and how we can improve, and to delve into uncharted waters; the needs of our Clients forever compelling us to think smarter, push ourselves harder, and exceed expectations at every turn. Regardless of what life puts in our way.
Dale Cleaver
Chief Executive Officer
Guide Dogs NSW/ACT
A report from our Chairperson
Soaring above and beyond the challenges of the past year.

A report from our Chairperson
Soaring above and beyond the challenges of the past year.
As I wrote this report for Guide Dogs NSW/ACT’s last annual report, I could never have imagined the year that lay ahead, nor the trials we would face. Twelve months on, and I am immensely proud of the agility the entire Guide Dogs NSW/ACT community has shown during the toughest of times.
From our staff and volunteers to our Clients and donors, it has been incredible to watch all of our stakeholders pivot and quickly adapt to each and every challenge the last financial year brought us; without ever once losing sight of our overall mission – to support those who now needed us more than ever before as the COVID-19 situation escalated.
We saw our Clients – people living with low vision or blindness – experience increasing isolation and anxiety as the world seemed to close in around us all. We also saw the determination of everyone at Guide Dogs NSW/ACT as they set aside their own feelings of uncertainty, and set to work finding new and effective ways to maintain the continuity of care our community has come to expect.
We also implemented our Client Advisory Panel (CAP) who have already started assisting us with the design and fit-out of our new premises in St Leonards to ensure the building will be optimised for people with low vision or blindness. Both the Board and the architects Guide Dogs NSW/ACT have contracted for this project have been delighted to have such high-quality and passionate Client input so early in the piece.
The CAP has also participated in the development of our next organisational strategy, as well as playing a significant role in informing the development of new Client policies and processes, including Client access to vaccinations, Client position statements and our overall Client communication strategy. It has been extremely valuable to work with such a dedicated team of Clients, and I look forward to our continued collaboration.
The Board of Directors and I have also taken great pride in following the achievements of our newly-established Dog and Fundraising Centres of Excellence; which see the Dog Services and Fundraising Teams across Guide Dogs NSW/ACT and Guide Dogs Victoria working together towards shared goals.
Our first Centre of Excellence – the Marketing and Communications Centre of Excellence – was formed back in late 2019 as part of our commitment to maximising our impact and getting the most out of every donated dollar, and the responsibility we have to our generous supporters to think commercially and sustainably. Since its inception, the Marketing and Communications Centre of Excellence alone has delivered close to $1 million in savings, giving us the evidence we needed to move forward with our Dog and Fundraising Centres of Excellence.
These Centres of Excellence will allow us to create more efficiencies, achieve economies of scale and reduce duplication, strengthen our national presence through local knowledge and on-the-ground support, lift performance and innovation levels and develop emerging leaders across both Guide Dogs NSW/ACT and Guide Dogs Victoria to deliver the highest impact for the people we support.
While we have seen the benefits of working collaboratively through the Centres of Excellence, we are also reiterating to staff that we don’t need to be part of a Centre of Excellence to strive for excellence in our work, or even to collaborate. The social media consolidation project we undertook in 2020, the recent launch of our new national brand, and our online Client Community Hub are all prime examples of how much can be achieved when we collaborate with Guide Dogs organisations across Australia.
By taking a more collaborative approach across all states and all teams – not just NSW/ACT and Victoria, and not just those teams that have taken on the title of Centre of Excellence – we get ever closer to our ultimate goal of providing a consistent and reliable service for Clients regardless of where in Australia they may be located.
Another hugely positive part of the last financial year was the sale of our Chatswood office. This unexpected surplus, in addition to an extremely strong last two years of fundraising and the commitment of all staff to continue utilising our supporters’ generous contributions as responsibly as possible, have given us the vital safeguard we need to head into this new era of opportunities, exploration and technological advancements.
We are unsure yet what the financial implications of COVID-19 will be on Guide Dogs NSW/ACT, but I am confident our planning to date will set us in good stead to handle any challenges we are yet to face. We will also still be looking to the generosity of our amazing supporters to deliver our day-to-day services and supports and can now take greater strides than ever towards adapting this assistance to the anticipated increased demand and ever-changing needs of those with low vision or blindness – in the ever-changing world in which we now find ourselves operating.
On behalf of the entire Guide Dogs NSW/ACT Board of Directors, I commend Dale Cleaver and his Executive Leadership Team for the leadership and strength they have demonstrated this year. I also wish to extend my sincere gratitude to my fellow Board Directors. Over the last financial year, we bade farewell to Director Preeti Bajaj – and we thank her for her dedication throughout her time on the Guide Dogs NSW/ACT Board – and this financial year, we welcomed our newest Board Director, Liz Ward.
To staff, volunteers, and donors, I simply say “thank you.” Thank you for not only rising to the challenges of the last 12 months, but for soaring above and beyond each and every one of them to ensure our Clients had the support they needed during the most difficult of times.
Mr Kieran Maurice Lane LLB Hons, LLM
Chairman
Guide Dogs NSW/ACT Board of Directors
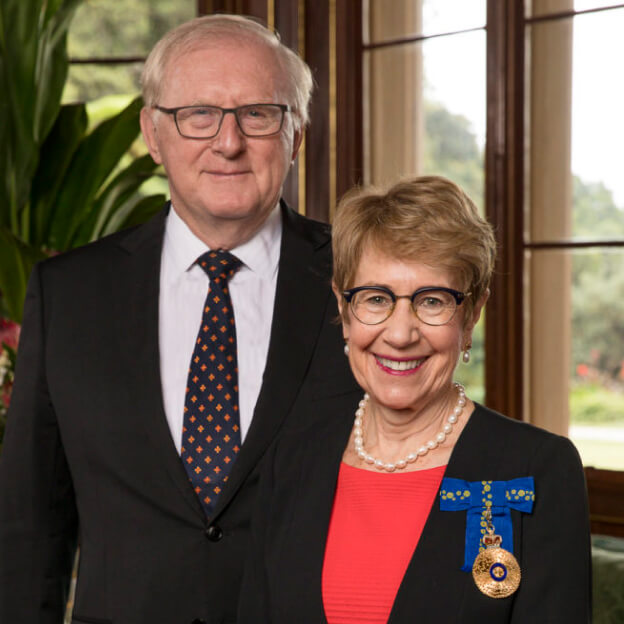
A message from our Patrons
A message from the joint Patrons of Guide Dogs NSW/ACT.
A message from our Patrons
A message from the joint Patrons of Guide Dogs NSW/ACT.
As Patrons, Dennis and I are delighted to continue the long relationship between the office of the Governor of New South Wales and Guide Dogs NSW/ACT.
While we dearly miss being with the Guide Dogs NSW/ACT community in person, we have remained steadfast admirers of the work we have seen over the last 12 months. With you, we have celebrated the achievements of staff, Clients, and volunteers. We have been humbled and inspired by the dedication of donors and the wider community who have helped to create life-changing Guide Dog partnerships.
Thank you for prioritising the health and wellbeing of the Guide Dogs NSW/ACT community and for using the challenges of the last year as motivation to achieve even bigger and better outcomes for those living with low vision or blindness, enabling them to maximise their independence.
We look forward to the time when we can once more welcome Guide Dogs NSW/ACT to Government House.
Her Excellency the Honourable Margaret Beazley AC QC
Governor of New South Wales
Our Clients.
hours of Client Services delivered including 35,323 hours for regional Clients.
lives positively impacted through our services, including Clients and their support networks.
white canes, tips and accessories provided.
Client programs delivered.
A walk from the heart.
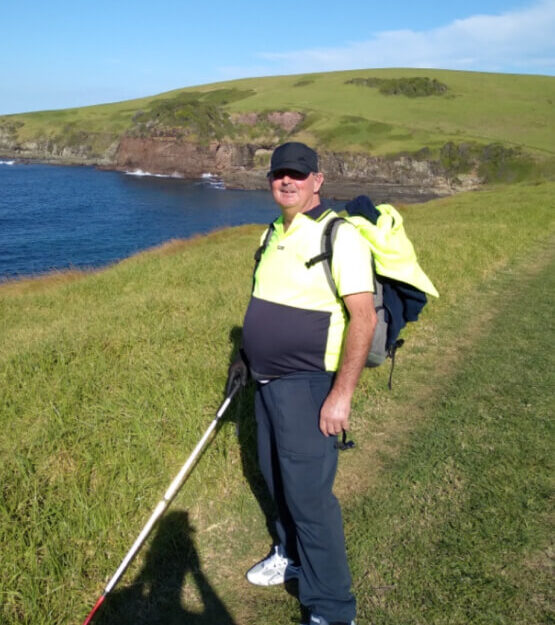
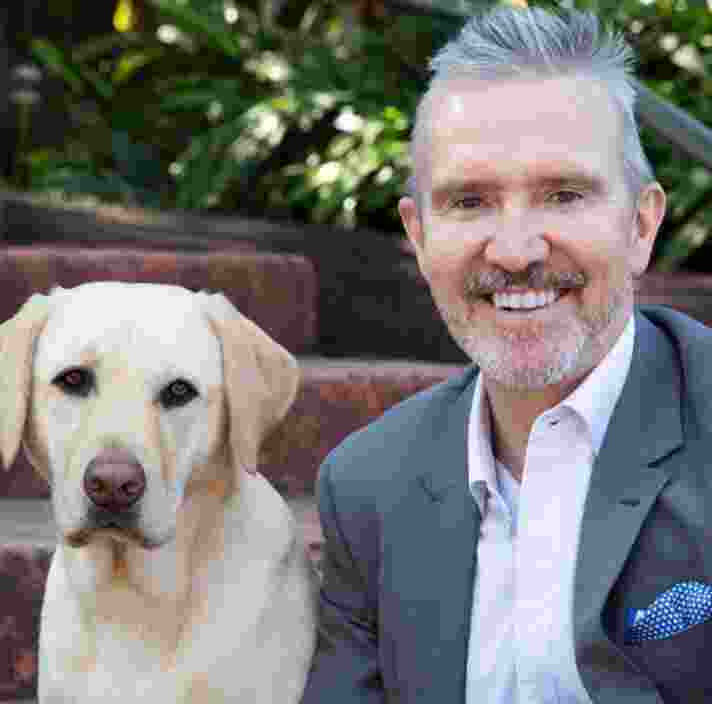
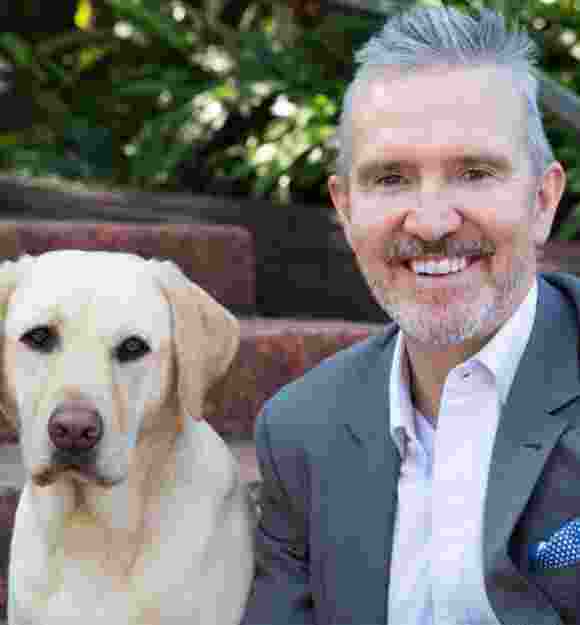
David's story
A walk from the heart.
David was born with Retinitis Pigmentosa, a degenerative eye disease that has decreased his sight over the last three decades, causing him to give up his thriving business, and his 23-year volunteering career as the captain of rural services.
A Guide Dogs NSW/ACT Client for over two years, David undertook an epic 100km walk from Vincentia to Kiama in 2021 to raise funds and show his appreciation.
“When my beautiful wife lost her battle with cancer last year, she left me a letter. She wanted me to keep learning things like my white cane skills so I could be independent. This walk was something I wanted to do to honour her. I used to rely on her for a lot of things. I never had to worry about anything because I had her support, but when it all happened, I had to change.
We enjoyed travelling, so the thought of being housebound would kill me. I had to push through my boundaries; learning, adapting and putting new systems in place. I refuse to surrender any task! You should never say ‘never’ because things are achievable.
When I first started training for the coastal walk – 103km over four days – I thought I had bitten off more than I could chew, but I know if you put your mind to it, you can do it. So, every day I’d do a minimum of four hours, averaging four kilometres per hour.”
David jokes as he recalls his intense training with Orientation and Mobility Specialist Paul:
“After that walk, there’s not much I don’t know about the cane! Paul would encourage me saying ‘you can do it, you can master this’ and because I’m stubborn, I was determined to give it my best shot.
Paul checked out the locations, picking out the problem spots and training me accordingly. Paul recommended I should do most of my walk on the beach as the original plan was going to be too dangerous. We even trained in the rain! And despite some minor accidents during this time, I kept going because I wasn’t going to let anything stop me.
I want to give special thanks to my friend Shane – my companion during the walk – and to my two support workers Patty and Donna who walked with me on training days and drove me between locations.
If anyone thinks things are unachievable, I say give it a go, because you never know!”
Services breakdown by type
- Assistive Technology — 5%
- Guide Dog Mobility Training — 21%
- Occupational Therapy — 6%
- Orientation and Mobility Training — 60%
- Orthoptics — 8%
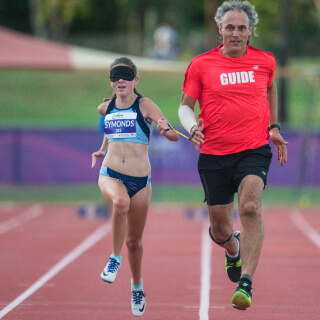
Karlee's story
A perfect match.
Born with a rare genetic eye disorder that causes severe low vision, eighteen-year-old Karlee has risen against the odds to achieve exceptional results at school, begin a medical science degree and carve out a stellar career in competitive athletics!
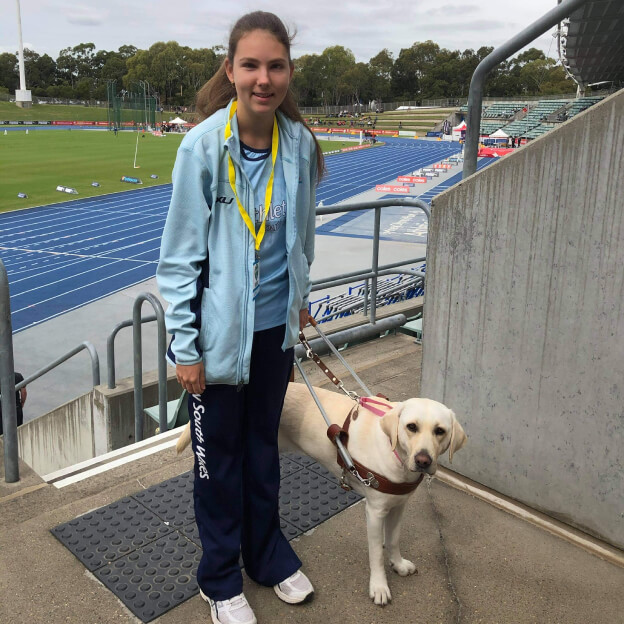
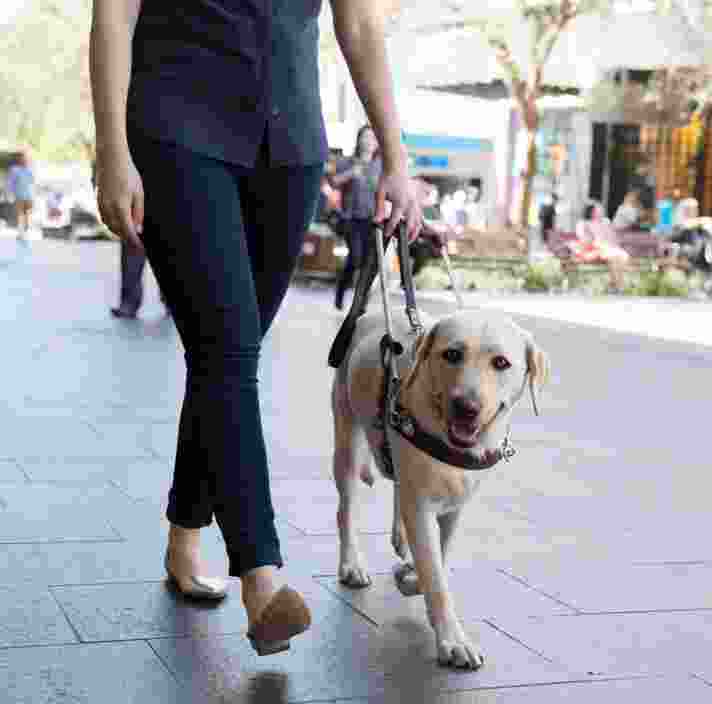
Karlee's story.
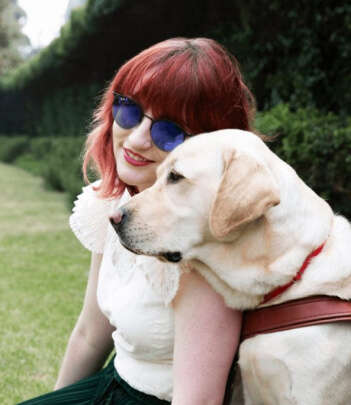
"With Olympia, I am able to walk much faster and travel independently which is the best feeling."
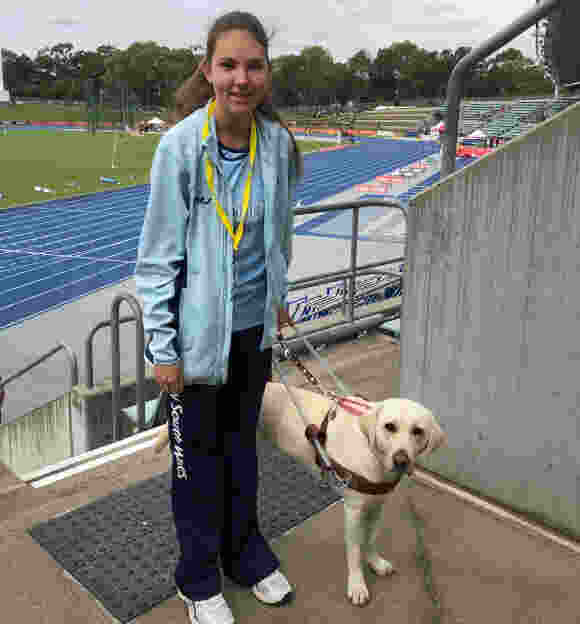
Born with a rare genetic eye disorder that causes severe low vision, eighteen-year-old Karlee has risen against the odds to achieve exceptional results at school, begin a medical science degree and carve out a stellar career in competitive athletics!
Karlee first came to Guide Dogs NSW/ACT when she was nine years old and just starting to use a white cane. At the age of 11, while at primary school, Karlee began participating in cross-country running and athletics, and started to progress through the ranks, qualifying to compete in national meets.
When Karlee started high school, her Physical Education teacher recognised her talent and encouraged her to take up running again. At the same time she recommenced her running, Karlee started working with Guide Dogs Orientation and Mobility Instructor, Paul, building her skills so that she could work towards being matched with a Guide Dog.
Karlee’s ultimate goal was to get a Guide Dog so she went through an intensive program. Karlee recalls her excitement about being on the Guide Dog waitlist during this time: “I would constantly check for news and updates about puppies being born and Guide Dogs graduating, hoping that one day, one would be my match.”
In February 2021, Karlee received the call she had been waiting for – she had been matched with a beautiful Labrador called Olympia. Karlee spent the next few weeks getting to know Olympia and undergoing intensive training with our Orientation and Mobility Team.
Olympia has already had such a significant impact on Karlee’s life.
“Before I had Olympia I struggled with independence. I had no confidence and struggled emotionally as I felt trapped and isolated. I dreamt of one day having the freedom and independence everyone around me had.”
“With Olympia, I am able to walk much faster and travel independently which is the best feeling. Olympia is a huge support to me at university and it’s crazy how close we have become. What’s even crazier is Olympia‘s name! Imagine my surprise at being matched with a dog called Olympia when I am aspiring to compete in the Paralympic Games! Not only is Olympia my eyes, she is my confidence, best friend and baby girl. I am so immensely grateful for Olympia‘s Puppy Raisers, Trainers and my Guide Dog Instructors for giving me this beautiful, clever girl.”
Karlee currently holds the T11 100 metre open Australian record as well as the 200 metre, 400 metre and 800 metre under-20 Australian records. Her goal in athletics is to qualify to compete in the 2024 Paralympic Games as well as future World Para Athletics Championships.
Centre for Eye Health
Guide Dogs NSW/ACT, in collaboration with The University of NSW, funds the Centre for Eye Health (CFEH). CFEH provides eye-disease assessment, management and treatments to patients at no cost. CFEH also undertakes world-class research and educates Optometrists to help decrease low vision and blindness within our community.
Impact of CFEH in FY21:
13,600 diagnostic and management eye consultations
8,160 patients examined for Glaucoma
2,720 age-related Macular Degeneration patients examined
1,904 Diabetic Retinopathy patients examined
816 patients examined for other conditions requiring urgent eye care
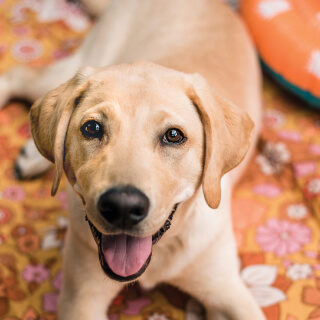
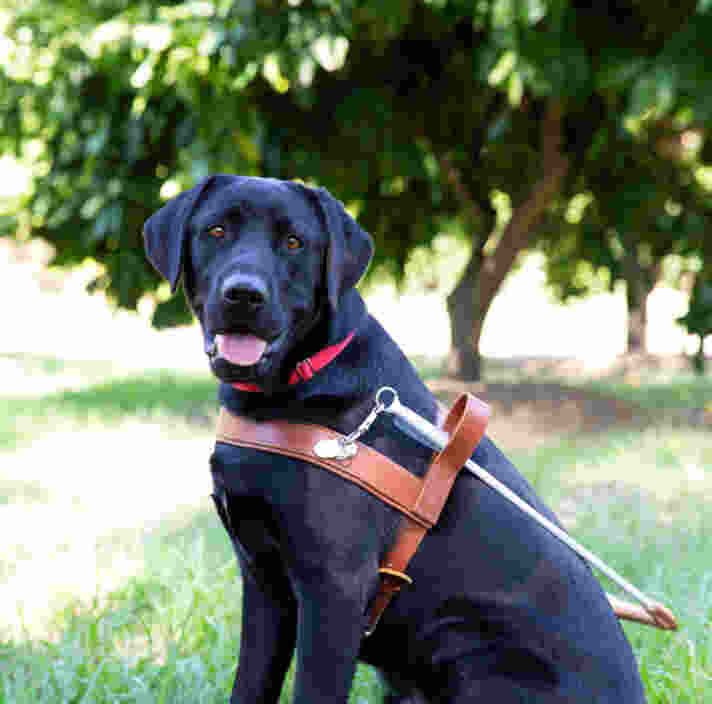
Our dogs.
hours of dog training sessions.
puppies born.
working Guide Dogs in the community.
Court Companion Dogs in the community.
We matched 126 dogs with their new Handlers including:
Guide Dogs.
Therapy Dogs.
Breeding Stock Dogs.
Collaboration proves crucial during COVID-19.
During COVID-19 lockdowns in Melbourne last year, telehealth practices went a long way towards supporting those who needed Guide Dogs Victoria the most – but what about the dogs? After all, they still needed to graduate on time so they could go on to make a vital difference in the lives of people with low vision or blindness. But COVID-19 restrictions had drastically limited the number of Guide Dog Trainers allowed onsite and this was one group of students who couldn’t be home-schooled.
That’s when the true spirit of collaboration and innovation shared by Guide Dogs Victoria and Guide Dogs NSW/ACT really kicked into high gear, and we stepped in to help their pups progress. Six pups in training were driven up to Guide Dogs NSW/ACT in August 2020 where they were greeted by Guide Dog Trainer, Gina.
Zadek, Zenda, Zosh, Carla, Watson and Volku quickly settled into their new home where they would spend the next three months being cared for – and of course put through their paces – by Gina and the Guide Dogs NSW/ACT team.
In November 2020, five of the pups had taken the next steps towards their new careers with two placed as Therapy Dogs in NSW, and three returning to Guide Dogs Victoria, ready for their final assessment to become fully qualified Guide Dogs. (While enthusiastic and loveable, the sixth pup Zadek didn’t quite have the skills needed to become a working dog and was reclassified and placed into a new home as a beloved pet.)
This was a huge achievement, not only for our Trainers across both states, but for the volunteer Puppy Raisers who had opened their homes and hearts to these pups who then faced an uncertain future once COVID-19 restrictions tightened across Victoria.
Most importantly, the strong bond we share with other Guide Dogs organisations – both nationally and internationally – led to improved outcomes for our Clients amidst some of the toughest times we have experienced as an organisation, and as a country.
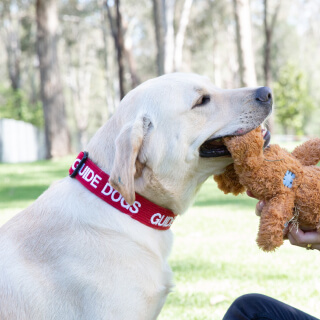
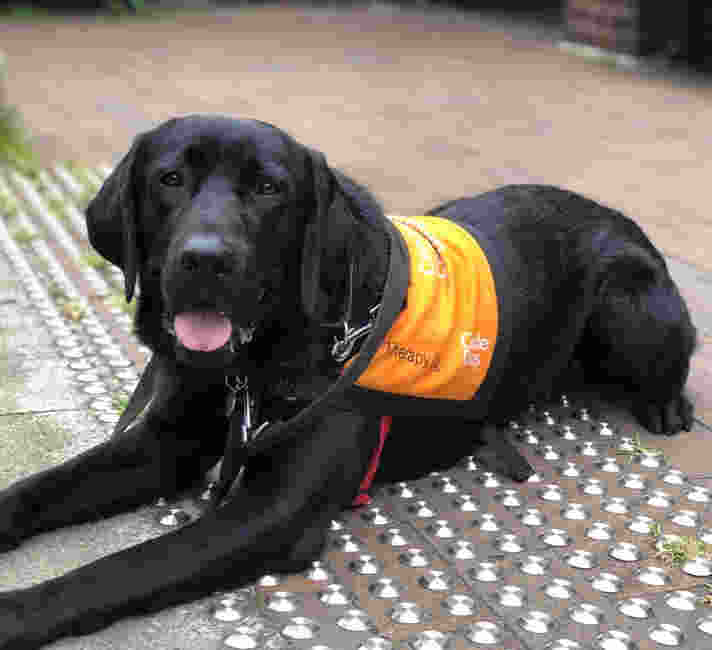
Meet Checkers
Meet Checkers, our longest-serving Court Companion.
This much-loved black male Labrador helps to create a friendly environment and reduce stress for court visitors. Guide Dogs NSW/ACT Puppy Raiser and Volunteer Handler, Gabbie, was paired with Checkers at the start of the program in 2018 and has been with him ever since.
Checkers takes on an extra bouncy and friendly persona when he is wearing his court uniform and has converted many court visitors into “dog people”. He enjoys spending time with Police Officers – recognising their distinctive uniform and heading their way for a pat.
The Canine Court Companion Program is a partnership led by Victims Services, NSW Courts and Tribunals and Guide Dogs NSW/ACT.
Our people.
Guide Dogs NSW/ACT wins SafeWork NSW Award.
In October 2020, Guide Dogs NSW/ACT was recognised for excellence and innovation in its work, health and safety response to COVID-19, winning a 2020 SafeWork NSW Award for ‘Outstanding work, health and safety response to the changed working environment due to COVID-19’.
Our people
Guide Dogs NSW/ACT wins SafeWork NSW Award.
Throughout the pandemic our focus has been on protecting the health, safety and wellbeing of our workers, Clients, volunteers, supporters and the broader community. COVID-19 has thrown a range of challenges our way. Our business is diverse which has made many of these challenges quite complex.
At Guide Dogs NSW/ACT we provide life-changing services to people with low vision or blindness, raise and train future Guide Dogs, engage with more than 500 volunteers and hundreds of supporters, and have workers in a mix of regional and metro locations. We’ve had to consider, manage and adapt a lot of moving parts.
But at Guide Dogs, we have always been in the business of overcoming barriers and this attribute is hardwired into the DNA of those who work for, and support us. We’ve demonstrated extraordinary agility to ensure continuity of service for Clients during COVID-19, including the rapid implementation and utilisation of innovative technology to deliver telepractice.
Clients are always at the heart of everything we do, the majority of which are over the age of 65 – a vulnerable category. They also face challenges relating to not being able to appropriately social distance due to a lack of visual cues and accessibility. We couldn’t take the risk of continuing face-to-face services for Clients or workers. We suspended them very quickly in comparison to many other businesses.
The organisation has continued to respond quickly with the help of a dedicated COVID-19 team to changing COVID-19 impacts in the community, enabling all staff to work remotely and establishing online wellness programs and weekly all-staff meetings to keep workers connected.
As one of Australia’s Most Trusted Charity Brands, it is important we maintain the trust so many people put in us every day, especially during this difficult time. To be recognised for the hard work, dedication and commitment it has taken to achieve a COVIDSafe environment for workers, Clients, supporters and volunteers was just wonderful.
employees.
volunteer Puppy Raising hours.
Puppy Raisers.
Guide Dog Centre volunteers.
Canine Court Companion Program volunteers.
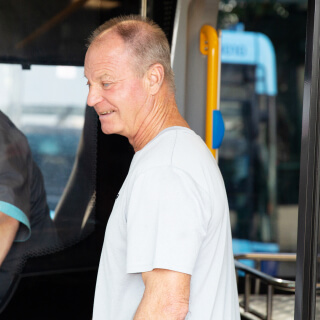
Celebrating staff milestones.
30 Years.
Michael Poynting – Guide Dog Program Integration Manager.
25 Years.
Barbara Bonfield – casual Speaker.
Belinda Carroll – Location Lead.
20 Years.
Anthony Woollam – Grounds and Maintenance Coordinator.
Jessie Jiang – Orientation and Mobility Specialist.
15 Years.
Christina Iffland – Supporter Experience Officer.
Kelly Prentice – Research and Project Coordinator.
Nathan Burford – Orientation and Mobility Specialist.
10 Years.
Kerry Chauncy – Puppy Development Advisor.
Our supporters.
raised from 143,471 donations
new Daisy Foundation members
Major Supporters donating more than $5,000
Guide Dog Partners
Instilling the value of giving back.
Inspired to give by the sight loss of his father, Harry, and subsequent support from Guide Dogs, Ron and his partner Louise have extensively supported Guide Dogs’ capital works at Glossodia and dog services support.
Instilling the value of giving back.
Mr. Ronald ‘Ron’ Kaiser has been a dedicated, generous Guide Dogs supporter since 2000.
Inspired to give by the sight loss of his father, Harry, and subsequent support from Guide Dogs, Ron and his partner Louise have extensively supported Guide Dogs’ capital works at Glossodia and dog services support. He has also been a Guide Dog Partner sponsoring three dogs, Louise Ilse, and Harry B. The latter, named after Ron’s late father, has gone on to a life of service as a fully-qualified Guide Dog.
Ron is a low key, humble man, who values Guide Dogs’ work in the community and enjoys involving his family in his philanthropy. A love of animals also clearly runs in the family with Ron’s daughter and son-in-law both trained and working as vets.
Ron said, “We’ve always supported Guide Dogs, but particularly when Dad went blind, Guide Dogs’ cause became even more important to us. It was so special to name dogs in honour of him and Mum, and my partner, Louise.”
“My joy of giving comes from the heart,” he continues. “Eyesight is so important and I treasure mine. I am lucky to be able to continue to support Guide Dogs in memory of my father and I think it’s so important to instil the value of giving back in our wider family.”
In 2021, Ron was made a Life Member of Guide Dogs. Thank you, Ron, for your incredible support.
Top 10 Donation Dogs.
- Coles Supermarkets
- Woolworths Supermarkets
- Gilgandra Services Club
- Merimbula RSL Club Ltd
- Cabra-Vale Diggers Club
- Blacktown RSL Club
- Wests Nelson Bay
- Soldiers Point Bowling Club
- Bondi Junction Veterinary Hospital
- IGA Supermarkets
Support groups.
- Central Coast Support Group
- Dubbo Support Group
- Mudgee Support Group
- Moree Support Group
- Tamworth Support Group
Pro Bono Support.
Thank you for your support.
-
Baker & McKenzie
Tower One - International Towers Sydney, Level 46, 100 Barangaroo Avenue, Sydney NSW 2000
-
Hall & Wilcox
Level 18, 347 Kent Street, Sydney NSW 2000
-
Colin Biggers & Paisley Lawyers
Level 42, 2 Park Street, Sydney NSW 2000
-
HWL Ebsworth Lawyers
Level 14, Australia Square, 264-278 George Street, Sydney NSW 2000
-
Technology Advisory Panel
Guide Dogs would like to acknowledge the members of the Technology Advisory Panel for their pro-bono contribution. Mr Alex Brak, Mr Scott Byrnes and Mr Daniel Xu.
-
Brace168 Ltd
• Guide Dogs would like to acknowledge Brace168 Ltd for the donation of $60,000 of cyber security services during the financial year.
Our National Corporate Partners.
We are proud to partner with the following organisations:

We would also like to acknowledge the generous workplace giving donations received from staff at the following organisations:
- AMP Foundation
- BHP
- Lion
- PETstock Assist
- The Deloitte Foundation
- Viva Energy Australia
- Westpac Group
-
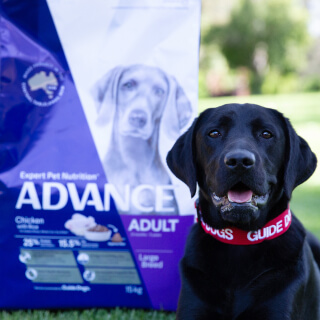
ADVANCE™
has provided 93 tonnes of Super Premium Dog Food in the past year to feed our national colony of dogs.
-
Boehringer Ingelheim
Animal Health Australia has provided over 4,000 vaccine doses and over 54,000 doses of Parasite protection in the last year alone.
-
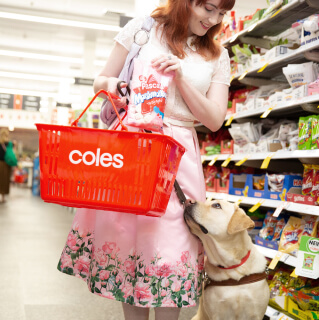
Coles
Our network of Collection / Donation Dogs in Coles stores have raised over $11.3 million since 1982, including over $934,000 this past year alone.
-
IDEXX
performed 870 complimentary pathology tests to support the health of our growing Guide Dog puppies.
-
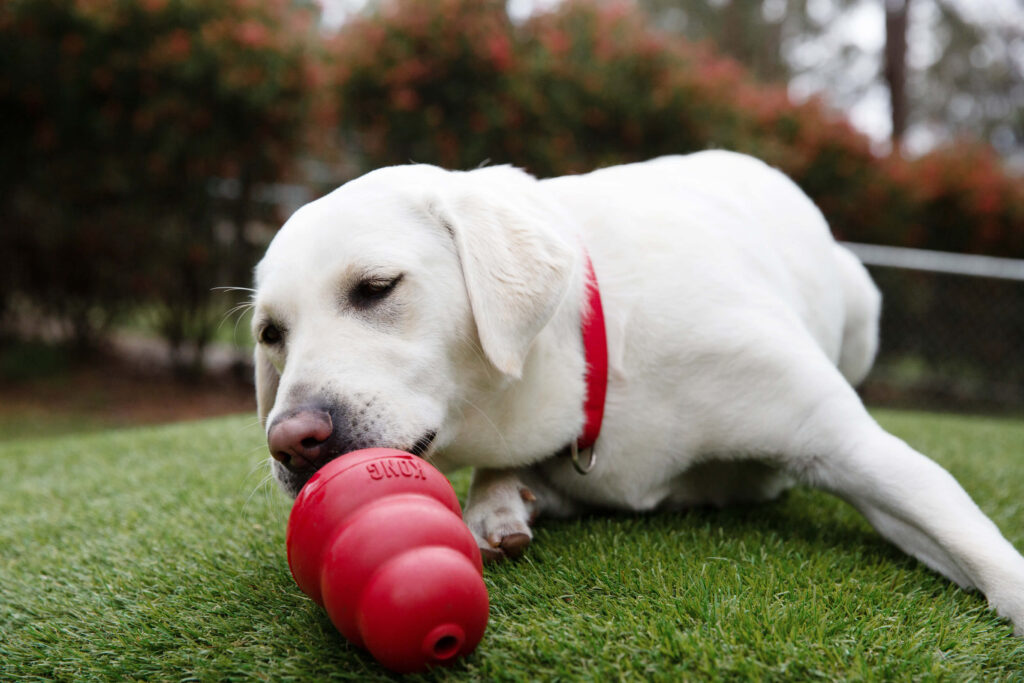
KONG
Over 6,000 toys were donated by KONG to help keep our dogs happy and stimulated over the last 12 months.
-
PAW by Blackmores
More than 130 kilos of PAW DigestiCare 60™ was supplied by PAW by Blackmores in the last year to support the health of our pregnant Breeding Stock and young pups.
-
PETstock
In June 2021, PETstock Assist’s ‘Guide Dogs Month’ campaign raised over $154,000 through customer and corporate donations, and the sale of participating products in-store and online.
We thank all of our partners.
We thank all of our National Corporate Partners for their ongoing commitment to our important work and their passion for supporting Australians living with low vision or blindness to reach their full potential.
Our reach.
social media impressions across all Guide Dogs Australia social channels.
social media increase year-on-year.
Guide Dogs NSW/ACT website sessions.
website sessions increase year-on-year.
Media reach.
A brand new chapter for Guide Dogs.
At the start of 2021, we were very excited to introduce our new Guide Dogs brand.
At the start of 2021, we were very excited to introduce our new Guide Dogs brand. Building on our beloved history, our new brand better reflects how we support people living with low vision or blindness today.
At Guide Dogs, we know the power of putting one foot in front of the other to face the world with courage. Our new brand is our way of carrying on with confidence. Our new brand builds on our beloved history, while telling a new story to better reflect how we’ll move forward together.
As one of Australia’s most trusted charities, our organisation draws on more than 60 years’ experience supporting people with low vision or blindness. A lot has changed in those 60 years. Today, we offer so many life-changing supports to all kinds of people in the community. We’ve added so many exciting chapters to our story.
To reflect these changes, we’ve created a new, more accessible Guide Dogs brand that will improve the way we sound and feel through images, colours, the way we talk, and more.
In the past, our brand has also not been as accessible as it should be for our Clients, and many of our supporters, employees and volunteers. In fact, people have told us of their challenges while reading and interacting with our brand in different situations.
Plus, our previous brand didn’t present the Guide Dogs family – which is a collection of state-based organisations – as one unified team offering the same services and supports to people no matter where our Clients live or their financial situation.
By exploring new ways for our brand to sound, look and feel, we can tell a story that better represents Guide Dogs, and ultimately provide better supports for people with low vision or blindness and their support networks.
Our brand launch gained great exposure in the press early on, including in:
- B&T – Iconic Charity Guide Dogs Australia Rebrands, Via FutureBrand
- Mumbrella – Guide Dogs Australia reveals new branding to strengthen national presence
- CMO (Chief Marketing Officer) – How a brand refresh is helping Guide Dogs Australia transform its national approach
In late 2021, the new Guide Dogs websites won gold in the annual global W3 Awards, were shortlisted in the Australian Access Awards*, and Guide Dogs – along with brand transformation partners FutureBrand – was shortlisted in three categories as part of the Transform Awards ANZ* for:
- Best Creative Strategy
- Best brand development project to reflect changed mission, values or positioning
- Best visual identity by a charity, NGO or NFP
*As at the time of publication, winners had not been announced.
Major campaigns
At Guide Dogs, Trust is at the heart of everything we do.
Major campaigns
At Guide Dogs, Trust is at the heart of everything we do.
There’s the unbreakable bond of trust between Handlers and their Guide Dogs. There’s trust in our services; trust that we go above and beyond to support people with low vision or blindness to live safely, independently, and to achieve their goals. We never take trust for granted and we strive for integrity in every single thing we do.
That’s why in November 2020, we launched our “With trust comes freedom” national campaign. This campaign was created to reinforce the importance of trust in the day-to-day life of a person with low vision or blindness and to celebrate their achievements.
This campaign also signalled the beginning of a three-year strategy to:
- Reposition our brand as a first choice provider for people with low vision or blindness.
- Create recall and awareness that we have a broad range of services to offer to increase referral rates and decrease the stigma associated with blindness so people seek help earlier and choose Guide Dogs.
- Signal a new look and contemporary voice for our brand.
- Reinforce the brand value of trust in our brand as a market differentiator.
- Leverage and reinforce our position as one of Australia’s Most Trusted Charity Brands.
- This campaign made a big impression on the wider Guide Dogs community, achieving 3,224,796 social media impressions and over 500,000 in media reach, being mainly key trade media.
People with low vision or blindness experience access challenges daily.
Video description: Michelle and Broden, a woman and a man, walk into an almost empty cafe but are refused a seat inside and are made to sit in the carpark by the bins. Later, Michelle and Broden are rejected a ride by a driver who refuses Broden access to his car. A new ride arrives and a Handler and her black Guide Dog enter the car. They are the real Michelle and Broden. The car drives off into the distance.
Access all areas
People with low vision or blindness experience access challenges daily.
This could include being illegally refused entry to a venue because they have a Guide Dog, or it might be because physical barriers, signage or a lack of information don’t allow for them to enter a place in an inclusive way.
It doesn’t have to be this way.
In March 2021, Guide Dogs launched a new “Access all areas” national campaign, which aimed to remove barriers for people with low vision or blindness and provoke change. Through the campaign, we shared first-hand access challenges, as experienced by people with low vision or blindness.
While the campaign focused on raising awareness of access challenges, it also aimed to support people with low vision and blindness to learn more about their access rights and how to self-advocate. We also released a range of online tools, tips and other resources for business owners to use to make their business more welcoming and inclusive.
The hero of our campaign – the video below – used humour to highlight some of the access challenges faced by people with low vision and blindness, and make them more relatable for the general public.
The video was created in collaboration with comedian and actor Michelle Brasier, who is also one of our Ambassadors and who featured in the campaign video with Ambassador Dog, Eva, and Broden Kelly from Australian comedy group Aunty Donna.
As part of this campaign, we also worked with the Melbourne International Comedy Festival to further highlight via social media, the importance of accessibility.
Media coverage.
As well as achieving outstanding results across our social media channels, the Access All Areas campaign proved to be a successful media campaign, focused on targeting quality Tier 1 media, with high syndications and high reach.
Television:
Sunrise, Channel 7 – Karen Hayes (CEO, Guide Dogs Victoria) interview: 613,500 reach, syndicated 38 times
Radio:
ABC NSW Statewide Radio – Charlie Spendlove (Head, Marketing and Communications Centre of Excellence, Guide Dogs VIC/NSW/ACT) interview: 216,100 reach, syndicated 36 times
Triple M – news bulletin: 374,400 reach, syndicated 24 times
ABC Melbourne – Michelle Brasier (GDV Ambassador and campaign talent) interview with Virginia Trioli: 61,000 reach
Social media impressions:
1,231,562
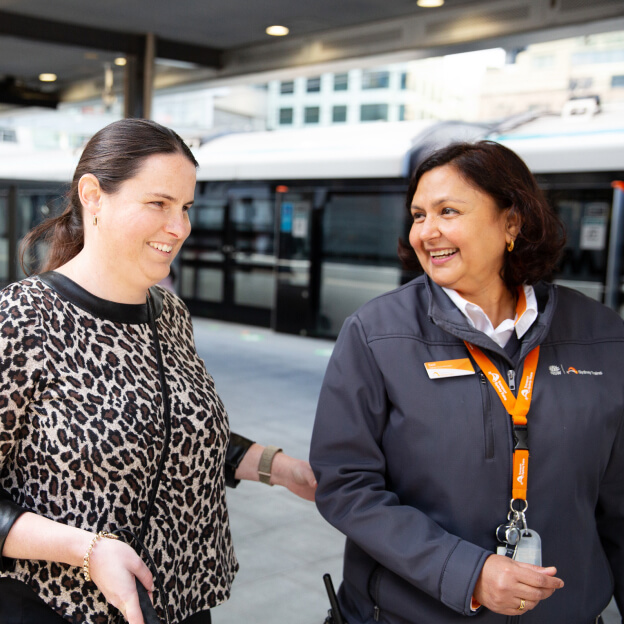
Creating connected communities
At Guide Dogs NSW/ACT, our Access and Advocacy Teams work tirelessly to remove barriers.
Creating connected communities
At Guide Dogs NSW/ACT, our Access and Advocacy Teams work tirelessly to remove barriers to ensure people with low vision or blindness can experience the world with freedom and independence.
Access and advocacy.
In FY 2020-2021, we:
- Provided industry training to 12 companies to improve frontline staff capability to support people who are blind or have low vision, including bus drivers and security guards.
- Provided access consultation to 41 different companies looking to improve the accessibility of their services and premises. Including transport companies, councils, and schools.
- Provided representation and advice to 56 different groups to advocate for systemic changes to improve the accessibility of services and spaces for people who are blind or have low vision, for example, Australian Standards, Government Committees, transport industry advisory boards.
Peer support and creating more connected communities.
Over the last financial year, our peer support groups continued to provide Clients with the opportunity to share their experiences with like-minded people in a more intimate and personal online setting.
Connections Services Client Consultation:
- Between October and December 2020, Connections Services engaged in a major consultative process to establish direction for the newly developed Connections Services. The consultation project attracted 134 total responses from Clients across a survey and online focus groups.
Regional face-to-face Connections programs between July 2020 and June 2021:
- Four region-based face-to-face activities were undertaken in metro north and northern regions.
- Across all these programs, 35 Clients participated and or contributed as co-designers.
Individual Peer Support Programs:
- Between August 2020 and the end of June 2021, there were 10 active individual Peer Support Programs, with six Peer Support Volunteers providing support in that time.
Chatter Paws special events:
- Between July 2020 and June 2021, Chatter Paws groups hosted seven guest speaker talks or special events. On average, these talks attracted 12 attendees. One special event, which was a nationally promoted special event attracted 25 attendees.
Revenue.
| Income | $ |
|---|---|
| Gifts in Wills | 20,043,415 |
| Donations and other fundraising activities | 11,363,195 |
| NDIS, Medicare and other government revenue | 5,898,879 |
| Income from investments | 2,138,559 |
| Contract Services income | 422,193 |
| Other income | 629,073 |
| Total Revenue | 40,495,314 |
Percentage of Income
- Gifts in Wills — 49%
- Donations and other fundraising activities — 28%
- NDIS, Medicare and other government revenue — 15%
- Income from investments — 5%
- Contract Services income — 1%
- Other income — 2%
Expenses.
| Expenditure | $ |
|---|---|
| Client and community services | 23,639,000 |
| Costs of fundraising and gifts in Wills | 5,545,665 |
| Marketing | 1,270,359 |
| Governance, finance, and administration | 6,198,096 |
| Total Expenditure | 36,653,120 |
Percentage of Expenditure
- Client and community services — 65%
- Costs of fundraising and gifts in Wills — 15%
- Marketing — 3%
- Governance, finance, and administration — 17%
Statement of Comprehensive Income.
| 2021 | 2020* | |
|---|---|---|
| $’000 | $’000 | |
| Gifts in Wills | 20,043 | 29,670 |
| Donations | 11,288 | 15,254 |
| Sale of fundraising merchandise | 75 | 128 |
| Investment income | 2,139 | 1,228 |
| NDIS, Medicare and other government revenue | 5,899 | 4,478 |
| Contract Services income | 422 | 396 |
| Other income | 629 | 743 |
| Revenue | 40,495 | 51,897 |
| Other gain/(losses) | ||
| Net gain/(loss) on financial assets including the fair value movement through profit and loss |
4,806 | (1,522) |
| Net gain on disposal of non-current assets | 37 | 17,389 |
| Total income | 45,338 | 67,764 |
| Client Services costs | (23,510) | (24,353) |
| Community education and advocacy | (129) | (99) |
| Fundraising overheads including: | ||
| – Fundraising donor management | (2,471) | (2,510) |
| – Planned giving expenditure | (832) | (706) |
| – Appeal costs | (2,242) | (3,576) |
| Marketing | (1,270) | (1,272) |
| Governance and administrative services | (6,198) | (6,074) |
| Total expenses | (36,652) | (38,590) |
| Net surplus from ordinary activities | 8,686 | 29,174 |
| Other comprehensive income | – | – |
| Total comprehensive income | 8,686 | 29,174 |
*Please refer to the full financial statements for the restatements of the FY20 numbers.
Statement of financial position.
| 2021 | 2020* | |
|---|---|---|
| $’000 | $’000 | |
| Current assets | ||
| Cash and cash equivalents | 9,267 | 4,399 |
| Trade and other receivables | 1,171 | 1,875 |
| Inventories | 80 | 28 |
| Other financial assets | 8,667 | 42,650 |
| Other current assets | 357 | 287 |
| Total current assets | 19,542 | 49,239 |
| Non-current assets | ||
| Other financial assets | – | 17 |
| Financial assets at fair value through profit or loss | 66,399 | 36,452 |
| Property, plant and equipment | 15,988 | 8,358 |
| Right of Use assets | 2,457 | 3,065 |
| Intangibles | 28 | 3 |
| Total non-current assets | 84,872 | 47,895 |
| Total assets | 104,414 | 97,134 |
| Current liabilities | ||
| Trade and other payables | 1,932 | 2,343 |
| Leasehold liabilities | 1,179 | 1,427 |
| Employee leave provisions | 1,812 | 1,643 |
| Total current liabilities | 4,923 | 5,413 |
| Non-current liabilities | ||
| Employee leave provisions | 269 | 335 |
| Leasehold make good liability | 115 | 115 |
| Leasehold liabilities | 1,547 | 2,397 |
| Total non-current liabilities | 1,931 | 2,847 |
| Total liabilities | 6,854 | 8,260 |
| Net assets | 97,560 | 88,874 |
| Accumulated funds | ||
| Accumulated surplus | 96,204 | 87,518 |
| Reserves | 1,356 | 1,356 |
| Total accumulated funds | 97,560 | 88,874 |
*Please refer to the full financial statements for the restatements of the FY20 numbers.
Gifts in Wills.
Thank you for your generosity.
Gifts in Wills.
Thank you for your generosity.
A-K
Albert Doyle
Alexander McDougall
Allan Willoughby
Anita Aston
Ann Wade
Anna Boydell
Anne Carolan
Arthur Dearden
Barbara Pearse
Barbara Staples
Beryl Hamilton
Betty Blacket
Betty Caddey
Betty Colgrave
Betty Cray
Betty Walsh
Betty Yeats
Beverley Northcote
Blanche Hayes
Boris Opic
Carol Falconer
Carol Madden
Catherine Faust
Charlotte Taylor
Christina Armour
Christina Burridge
Clarice Carmichael
Cora Beehag
Coral McConnell
David Hensler
Diana Lobb
Diane Pryor
Dianne Krummel
Ditmar Dullies
Doreen Canavan
Doreen Crawley
Dorothea Whittome
Douglas Walker
Douglas Webb
Dulcie Curtis
Edward Dwyer
Elaine Loewe
Elizabeth Braithwaite
Elizabeth Brown
Elizabeth Scully
Enid Primmer
Esma Pope
Florence Campbell
Francis Hornibrook
Frank Keston
George Clark
Gerald Goldberg
Geraldine Lambert
Glendwyr Wake
Gwendoline Hicks
Gwendolyn Allis
Gwenneth Whybrow
Heather Dirou
Heather Priddle
Helen Felder
Helen Ford
Ian Boulton
Irene Eaton
Iris Sadler
J-Alice Hofler
James Howard
James Muir
James Stewart
Janet Timmins
Jannette Ferguson
Jennifer Foster
Joan Bell
Joan Boyle
Joan McKinnon
Johanna Wyld
John Durrant
John Giles
John Pike
John Richards
John Stevens
Josephine Virgona
Joyce Hamilton-Smith
Joyce Towns
Juergen Frank
June Hilder
Katharina Liebig
Kathleen Blakeney
Kenneth Berckelman
Kenneth Harbron
Kenneth McKevett
Kondelea Elliott
L-Z
Leslie Nixon
Louis Hervay
Lyle Chivers
Manfred Milosevic
Margaret Cook
Margaret Crawley
Margaret Hill
Margaret Watson
Margaret Watts
Maria-Teresa Shepherd
Marie Campbell
Marie Morgan
Marie Taylor
Marilyn Clarke
Marjorie Bagley
Marjorie Lawn
Mary Brauer
Mary Brown
Mary Davie
Mary Green
Mary Mackinn
Mary McCrodden
Mary Tobin
Michael Youl
Micheil Gibb
Minnie Condon
Mollie Makin
Nance Holmes
Nessie Appleby
Neville Ellis
Neville McCarthy
Nina Pickering
Norma MacGregor
Pamela Poland
Pauline Barker
Peter Bathis
Peter Jenkins
Prudence McDermott
Queenie Topley
Ralene Paul-Furley
Ralf Moller
Ratilal Pala
Raymond Hall
Raymond Haswell
Robert Clarke
Robert Martin
Robert McDonagh
Robert Pauling
Robert Reid
Robert Vale
Robin Opitz
Rodney Glendenning
Ruby Mathews
Ruth Boxwell
Ruth McAuley
Sanchia Cochran
Sharyn Murdoch-Daly
Sheila Shakespeare
Sheila Woodcock
Shirley Apelt
Shirley Arthur
Shirley Henderson
Shirley Slater
Stanley Johanson
Stanley Pendall
Stephanie Morgan
Susan Bateman
Susan Burke
Susan Cross
Susan Hutchinson
Sylvia O’Cass
The Bill and Joy Barrie Foundation
The Eleanor Smith Trust
The John and Connie Kennedy Trust
The Kemvan Trust
The Prance Family Trust
Thelma Tedder
Thomas Tuite
Trevor Mackey
Valerie Davies
Valerie Harris
Valerie Smith
Valma Wedlock
Vera McCulla
Walter Kovalski
Warwick Adams
William Nixey
William Schuberg
Winifred Atwell
Yvonne Shipley
Thank you for your generosity.
Our Board of Directors.
-
Joining the Board in 2012, Kieran is a Solicitor and former tax partner at KPMG. Kieran also served as an elected member of the KPMG Board for six years.
-
James is a Mechanical Engineer and self-employed Disability Services Auditor, as well as a Guide Dogs Client and experienced Guide Dog user.
-
Ian is a strategic marketing consultant, co-founder of business strategy consultancy firm Marketing Initiatives, and a Fellow of the Australian Marketing Institute.
-
Jacqui is Executive Director of the Constellation Project at PwC, with more than 25 years’ experience improving outcomes in education and homelessness.
-
Steve is a Lawyer and commercial advisor with extensive corporate governance and leadership, strategic planning, and risk management expertise.
-
Robin brings broad sector experience across financial services, technology, medical research funding, M&A and governance / risk.
-
Darryl has an extensive and varied executive career in accounting, consulting, finance and risk management roles.
-
Liz is an experienced commercial senior executive with 16 years’ experience at Chief Executive level in New Zealand and Australia across multiple sectors.


Governance
Learn more about our governance.
In memoriam
It was with great sadness that we farewelled some beloved members of the Guide Dogs NSW/ACT family.
It was with great sadness that we farewelled some beloved members of the Guide Dogs NSW/ACT family.
Chace Richardson.
It was with great sadness that in May 2021, we farewelled a beloved member of the Guide Dogs NSW/ACT family, Chace Richardson.
An Orientation and Mobility Specialist in the Guide Dogs NSW/ACT Southern Team, Chace was a well-respected and valued member of the organisation.
His vibrant and caring nature is sadly missed, not only by his colleagues and Clients in the Southern area but more broadly across the Guide Dogs family.
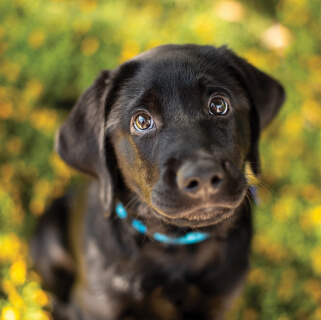
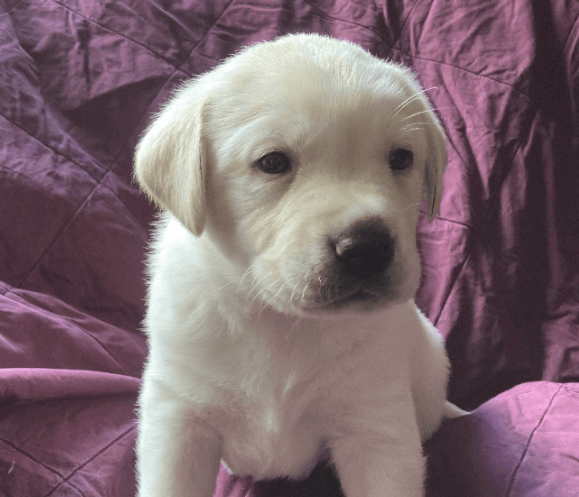
Introducing puppy Chace.
Born at the end of May 2021, this adorable bundle of fur (just four weeks old in this photo) was named Chace in memory of our colleague and friend Chace Richardson.
Puppy Chace will go on to live with a volunteer Puppy Raising family for the next 12 months, where he will get the love, care and training to hopefully one day become a life-changing Guide Dog, carrying on his namesake’s legacy.
Ready to continue?
Seems like you have filled this form earlier. Let’s pick up where you left off.